The Most Hated Rally Ever Is A Gift For Investors To Now Sell
The S&P 500 has rallied nearly 30% in just three weeks since the March lows despite the ongoing global pandemic.
The environment and economic outlook remain deeply bearish for stocks which are now once again expensive and face significant downside.
The market is too complacent over the risks that the recovery process will be weaker than expected.
Now is the time reduce equity exposure.
Looking for a portfolio of ideas like this one? Members of Core-Satellite Dossier get exclusive access to our model portfolio. Get started today »
Amid the ongoing coronavirus pandemic and global economic disruptions, financial markets have experienced extreme levels of volatility. From a drawdown of 34% in the S&P 500 Index (SPY) and 29% for the NASDAQ-100 (QQQ) at the lows in March, the market has staged an impressive rebound in recent weeks. SPY is now down only 10% year to date while QQQ is up with a positive gain in 2020. While some of the most apocalyptic scenarios for the outbreak may have been averted, we believe the environment remains deeply bearish for U.S. and global equities. We see this market rally as an opportunity to reduce risk exposure and position for the next leg lower.
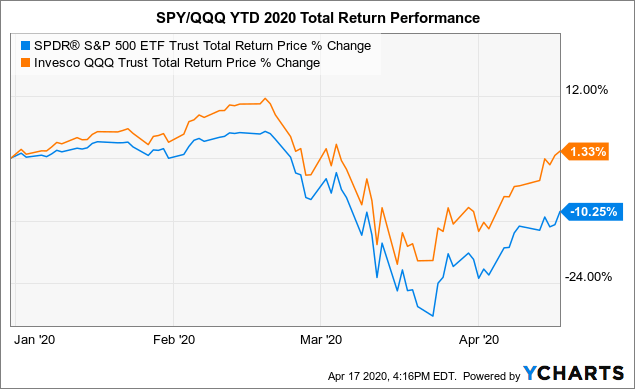 Data by YCharts
Why the market has surged?
Understandably, many people that have been impacted by the coronavirus or even just forced to quarantine may hate this rally. The move higher in stocks is in part based on the hope that the enormous coordinated monetary easing measures by the Fed and government relief efforts will cover the near-term repercussions of the nationwide lockdown. There is a thinking that economic conditions will normalize over the coming months. We are skeptical of this apparent consensus.
Focusing on the broad market indexes is slightly misleading. The top holdings of the S&P 500 and tech-heavy NASDAQ-100 are dominated by just a few names. Specifically, Microsoft Corp. (MSFT), Apple Inc. (AAPL), Amazon.com (AMZN), Alphabet Inc. (GOOGL)(GOOG), and Facebook Inc. (FB) together represent 20% of SPY and 45% of QQQ.
| Stock (weighting in ETF) | SPY | QQQ |
| Microsoft Corp. (MSFT) | 5.8% | 11.9% |
| Apple Inc. (AAPL) | 5.1% | 11.3% |
| Amazon.com (AMZN) | 4.3% | 10.6% |
| Alphabet Inc. (GOOGL)(GOOG) | 3.2% | 7.1% |
| Facebook Inc. (FB) | 1.8% | 3.8% |
| % of Total | 20.2% | 44.7% |
It makes sense that these tech market leaders with generally strong balance sheets should be at least relatively more resilient to the current situation compared to companies in industries that have been directly disrupted by the current situation. The mega-cap tech names have essentially carried the indexes considering the 29% and 13% year-to-date gain for Amazon and Microsoft each and only small declines for Apple and Alphabet this year.
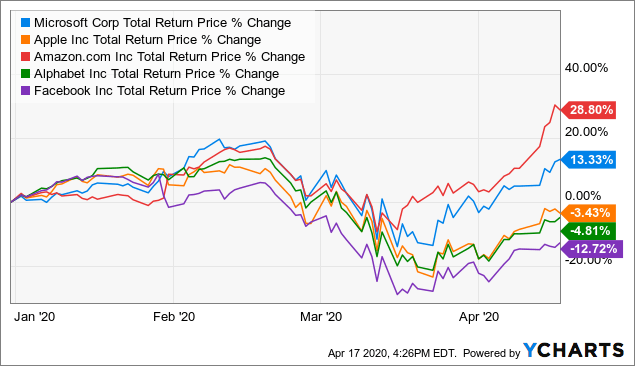 Data by YCharts
The trends highlight what has been a major divergence among large-cap stocks compared to small-caps which are often seen as riskier with weaker fundamentals. The Russell 2000 Index (IWM) is still down by 26% this year compared to the 1% gain for QQQ. Indeed, the hardest-hit industries like retailers, restaurants, and oil and gas take a more prominent role in the small-cap index which may be a better reflection of underlying conditions in the economy. As we argue below, we think the strength among large-caps is unjustified and that group may lead the market lower going forward.